Debug on Atom with PHP XDebug
This tutorial shows how to debug PHP on Atom Editor.
# 1. Install xdebug
sudo apt install php-xdebug
# 2. Check installation
Create a temporary file to display your phpinfo information:
cd
echo "<?php phpinfo();" > phpinfo.php
php -S localhost:3000
    PHP 7.3.6-1+ubuntu19.04.1+deb.sury.org+1 Development Server started at Wed Jun  5 17:20:29 2019
    Listening on http://localhost:3000
    Document root is /home/daniel
    Press Ctrl-C to quit.
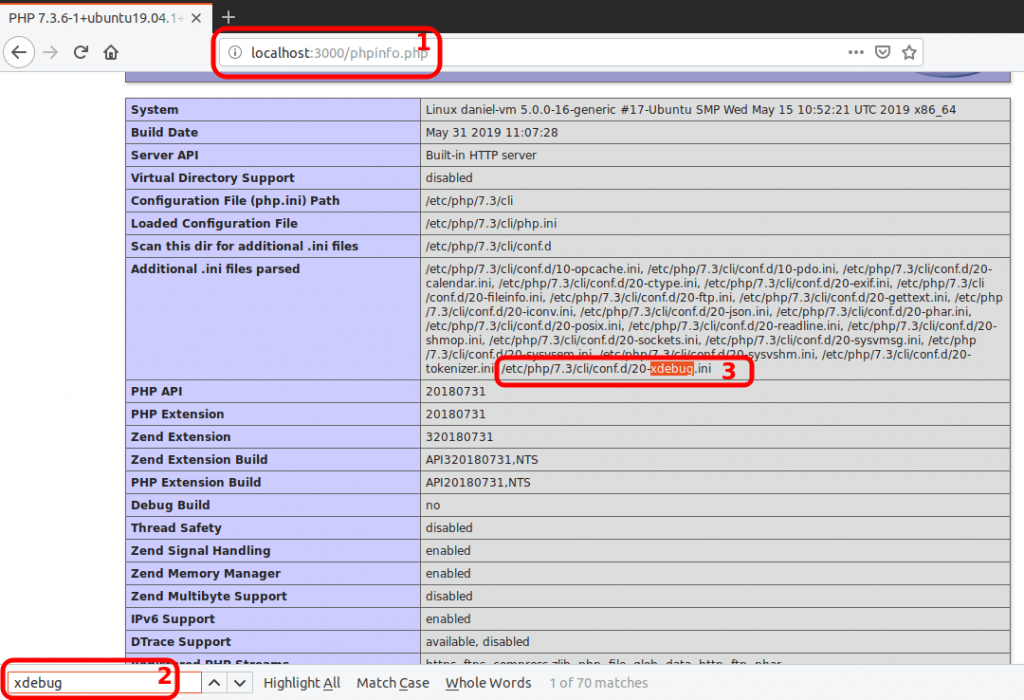
Now, (1) open the page, (2) search for xdebug, and (3) get the xdebug.ini path:
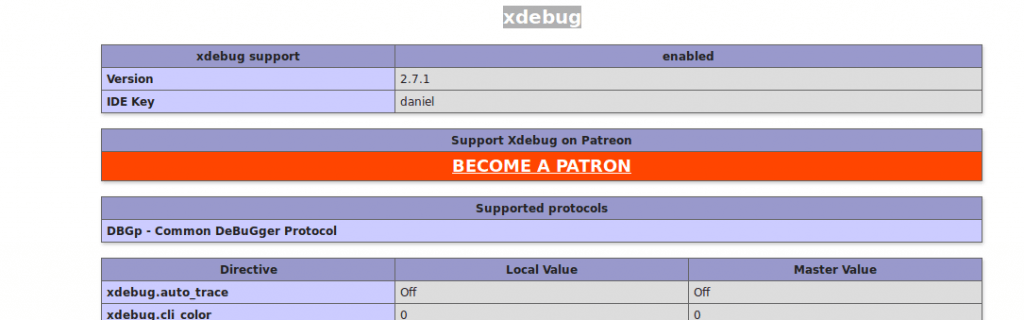
Down on the same page, check if the module is enabled:
Now you can remove the phpinfo.php file (optional):
cd
rm phpinfo.php
# 3. Add these lines to xdebug.ini
# /etc/php/7.3/cli/conf.d/20-xdebug.ini

# xdebug v2.x
xdebug.remote_enable=1
xdebug.remote_host=127.0.0.1
xdebug.remote_connect_back=1    # Not safe for production servers
xdebug.remote_port=9000
xdebug.remote_handler=dbgp
xdebug.remote_mode=req
xdebug.remote_autostart=true

# xdebug v3.x
xdebug.mode=debug
xdebug.start_with_request=yes # try "trigger" if not working
xdebug.client_port=9000
# 4. Install php-debug plugin on Atom
In Atom, install package php-debug by gwomacks:
Ctrl+Shift+P > Install Packages and Themes > php-debug
I recommend you to install the suggested plugins:
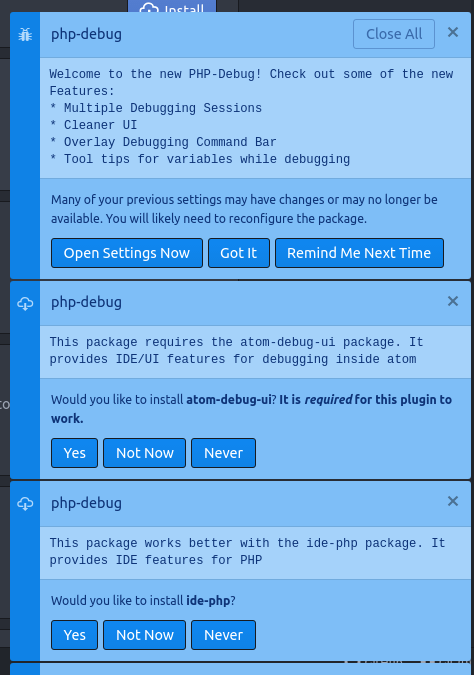
TIP
If you click to install the suggested plugins, wait until you get a success notification for each plugin before closing Atom.
# 5. Re-start Atom editor
# 6. To add breakpoints, click on the marker ruler
WARNING
There are 2 breakpoint rulers (the blue dots): Use the one at right (the small blue dot, not the big)

# TROUBLESHOOTING
If it doesn't work, you have probably edited the wrong
xdebug.inifile. The path with/cli/folder on it is for the standalonephp -Scommand. If you are using Nginx/Apache or FPM, then it's a different path.In older versions of Atom Editor, you had to OPEN the "php debug" panel. You can open it by clicking on the bottom-left button on Atom. If the "php debug" panel is closed, the breakpoints WILL BE IGNORED. This has been fixed in more recent versions, but some bugs can return – so double-check this.
There is a FAKE breakpoint: the one on the left. The correct one is the one at RIGHT. If you set the other breakpoint, it will be ignored.
Re-start Atom: Have you tried turning it off and on again?