PHP
Tools
VSCode
Debug
PHP Debugger on VSCode
This tutorial shows how to debug PHP on VSCode Editor.
# 1. Install xdebug
sudo apt install php-xdebug
# 2. Check installation
Create a temporary file to display your phpinfo information:
cd
echo "<?php phpinfo();" > phpinfo.php
php -S localhost:3000
    PHP 7.3.6-1+ubuntu19.04.1+deb.sury.org+1 Development Server started at Wed Jun  5 17:20:29 2019
    Listening on http://localhost:3000
    Document root is /home/daniel
    Press Ctrl-C to quit.
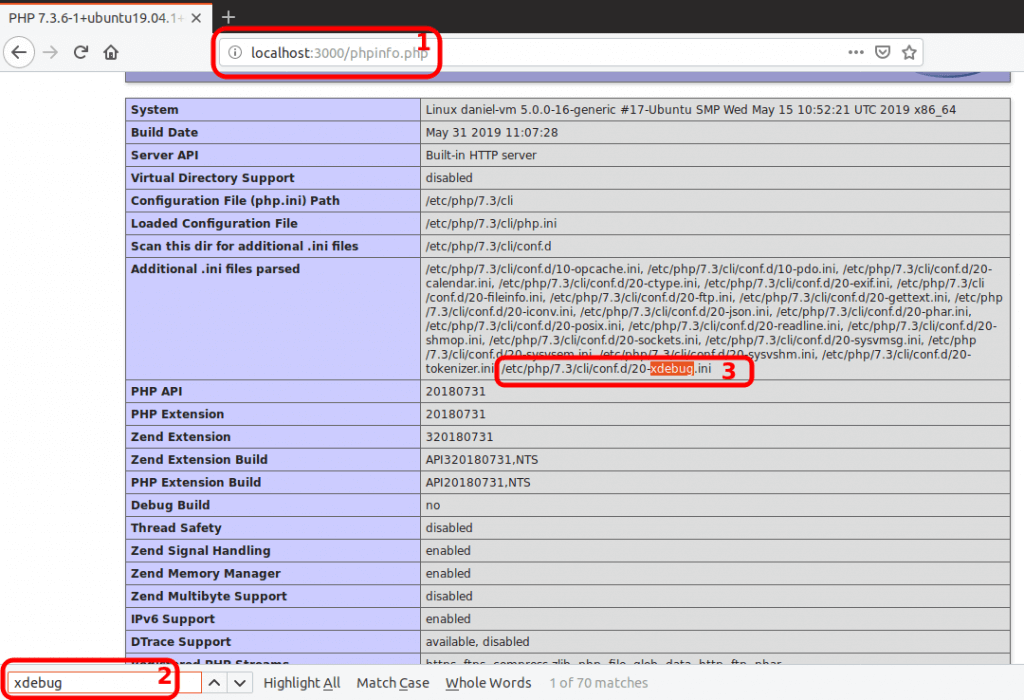
Now, (1) open the page, (2) search for xdebug, and (3) get the xdebug.ini path:
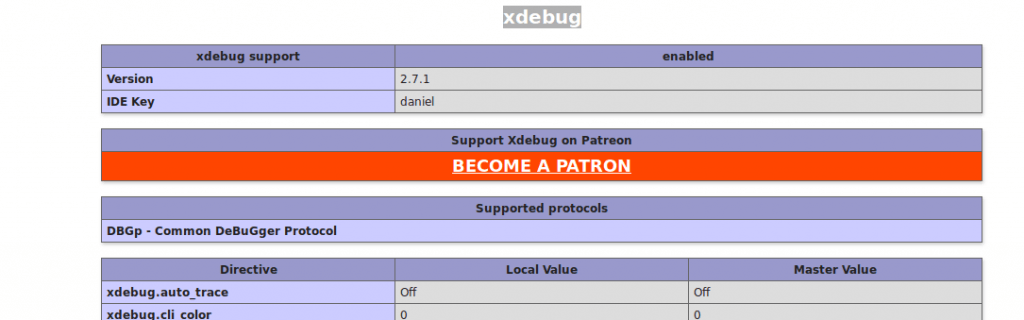
Down on the same page, check if the module is enabled:
Now you can remove the phpinfo.php file (optional):
cd
rm phpinfo.php
# 3. Add these lines to xdebug.ini
# /etc/php/7.3/cli/conf.d/20-xdebug.ini

# xdebug v2.x
xdebug.remote_enable=1
xdebug.remote_host=127.0.0.1
xdebug.remote_connect_back=1    # Not safe for production servers
xdebug.remote_port=9000
xdebug.remote_handler=dbgp
xdebug.remote_mode=req
xdebug.remote_autostart=true

# xdebug v3.x
xdebug.log_level=0
xdebug.mode=debug
xdebug.start_with_request=yes # try "trigger" if not working
xdebug.client_port=9000
# 4. Install PHP Debug plugin on VSCode
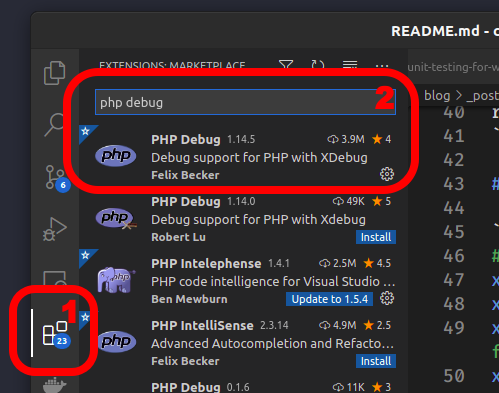
On VSCode,
(1) Click on Extensions tab (Ctrl+Shift+X); and
(2) Install package PHP Debug by Felix Becker:
# 5. Re-start VSCode editor
# 6. Debugging
# 1. Click on Run tab (Ctrl+Shift+D)
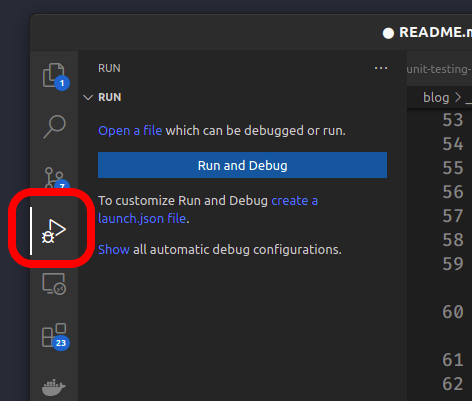
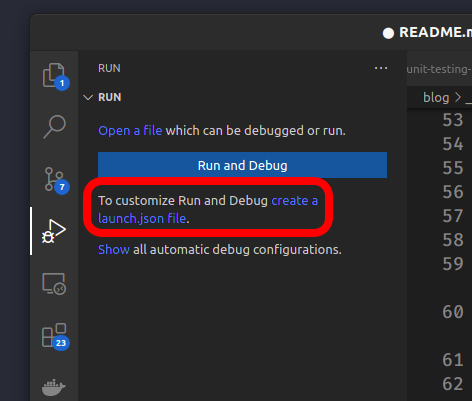
# 2. Click on create a launch.json file
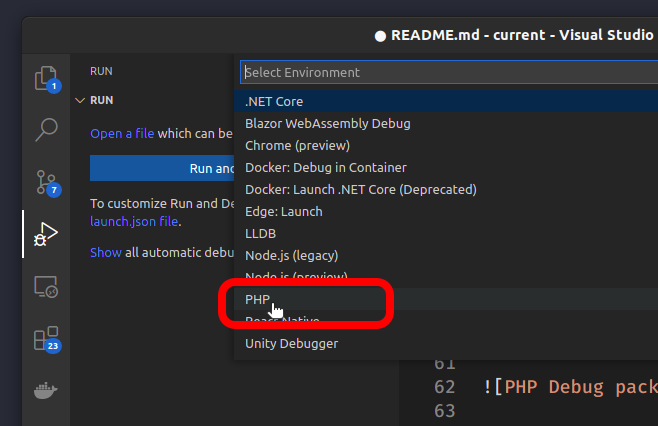
# 3. Click on PHP
You can close the launch.json file:
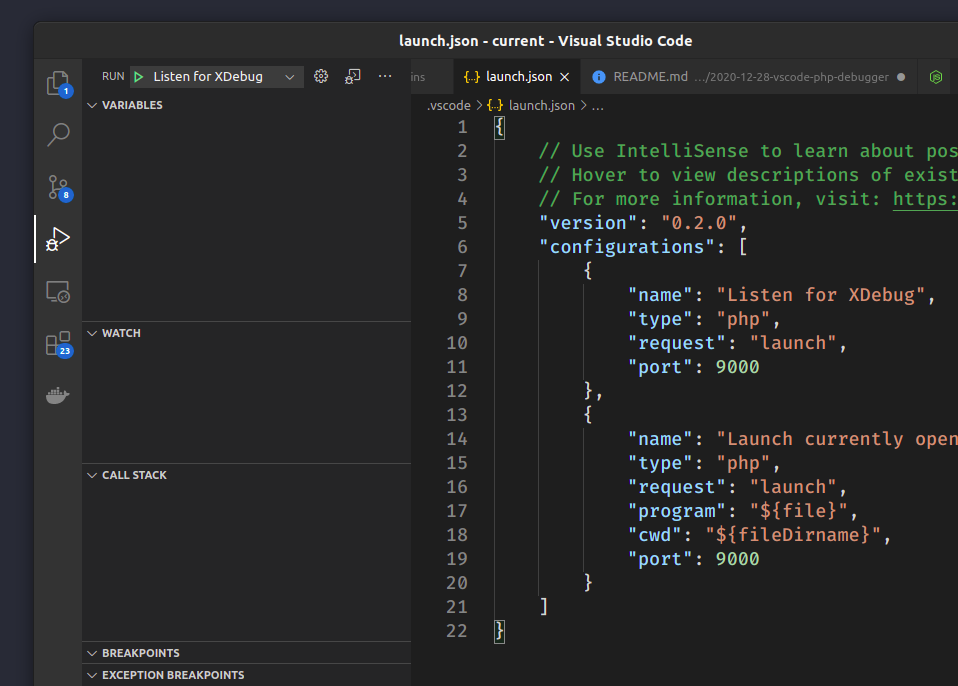
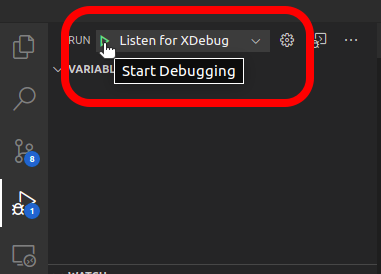
# 4. Click on the Play icon
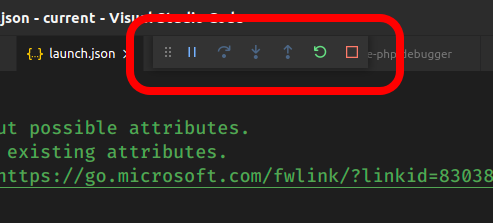
The debugger tools will appear:
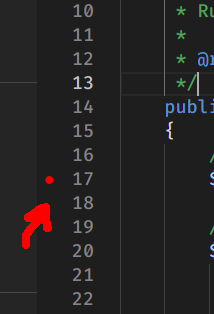
# 5. Set breakpoints (click on the ruler)
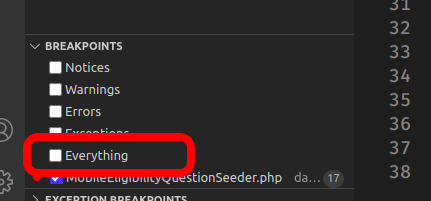
TIP
Unselect Everything for performance and for your sanity.